


.jpg)
.jpg)
 Back
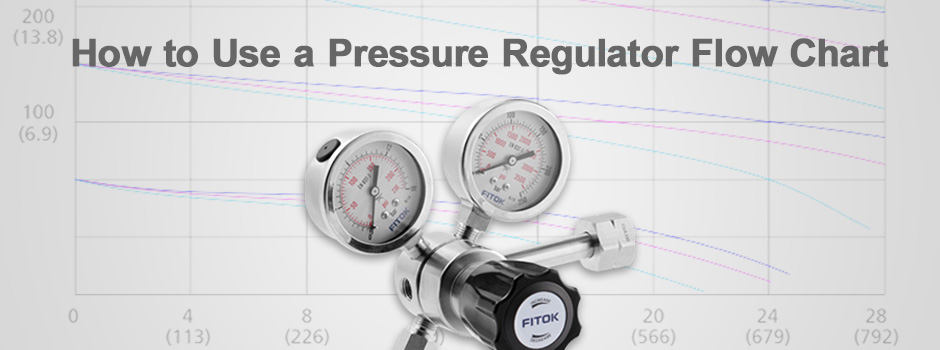
Back Pressure Regulator Explained (III) : How to Use a Pressure Regulator Flow Chart

Basic Knowledge
Principle and application of pressure regulators
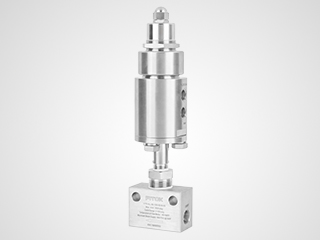
The pressure regulators adopt a special flow path structure (as shown in Figure 1). When the high pressure medium flows through the orifice from the inlet, the flow rate of the medium increases and the pressure decreases, thus achieving the purpose of pressure regulation. In addition, the pressure regulators can balance the medium load generated by the inlet pressure and the outlet pressure by adjusting the spring load, so as to control the outlet pressure and maintain it, and the force balance of the pressure regulators meets the formula (1).
Fload element = Fsensing element + Fcontrol element Formula (1)
Where:
Fload element = range spring load
Fsensing element = outlet pressure × diaphragm effective area
Fcontrol element = inlet pressure × poppet effective area + poppet spring load
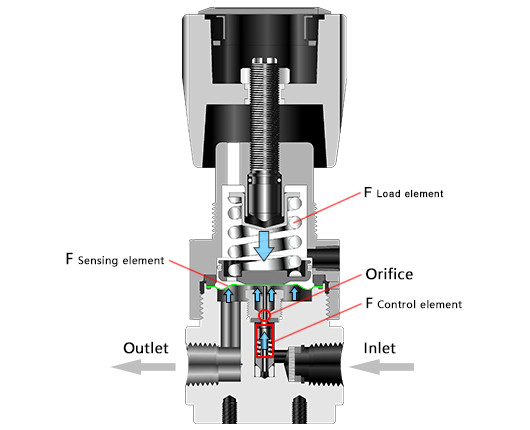
Figure 1 Structure Diagram of Pressure Regulators
The main purpose of the pressure regulators is to reduce the upstream inlet pressure to the set outlet pressure value and maintain it, so as to meet the specific system pressure requirements. Pressure regulators are widely used in the fields of special gas, high purity and the like.
Composition and function of a flow chart
The flow chart (shown in Figure 2) describes the relationship between flow rate (horizontal axis) and outlet pressure (vertical axis) of the pressure regulators at a given inlet pressure. From this chart, we can see the response state of the pressure regulators when the flow rate in the system changes. It describes the range of system pressures that a pressure regulator can maintain at given flow rates.
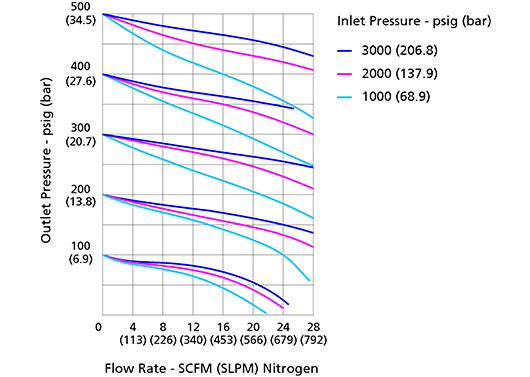
Figure 2 Flow Chart of Pressure Regulators
From the flow chart, we can judge whether the selected pressure regulators meet the requirements of actual system working conditions (pressure, flow rate, etc.), thus contributing to rapid part number selection.
How to Use a Flow Chart?
Flow chart analysis
Valve manufacturers usually provide multiple flow curves for the same series of regulator at different inlet pressures and the same outlet pressure to illustrate the operating range of the regulator. As shown in Figure 2, the horizontal axis represents the flow rate, the vertical axis represents the outlet pressure value, and the inlet pressure is represented by curves of different colors, such as 3000 psig (206.8 bar), 2000 psig (137.9 bar) and 1000 psig (68.9 bar). When the flow rate is 0, the outlet pressure shown in the vertical axis is the outlet set pressure.
The flow curve shows a "droop" trend, that is, under a certain inlet pressure and outlet set pressure conditions, with the flow rate gradually increases, the outlet pressure gradually decreases. As the internal structure and component limit, pressure regulators cannot provide a perfect horizontal flow curve in a particular regulating state. As a consequence, when the pressure regulators respond to the increase of flow rate, the outlet pressure will decrease to some extent.
For pressure regulator application, it is usually required to maintain a relatively constant outlet pressure when the system flow changes greatly. Therefore, the less droop of the flow curve, the better performance of the pressure regulator.
How to use a flow chart
For a certain type of pressure regulator, first find the corresponding flow chart, and select the corresponding curve according to the actual inlet pressure and outlet set pressure values. Then find its corresponding point on the curve according to the horizontal axis flow rate scale and get the actual outlet pressure of that point from vertical axis. If the flow curve for the required pressure condition can't be found in the pressure regulator flow chart provided, a new curve can be deduced between two adjacent existing curves.
In addition, the flow chart provided by the manufacturer is based on test conditions when the test medium is nitrogen and the test temperature is 70℉ (20°C). If the actual system uses other medium and at other operating temperature, the flow rate scale in the horizontal axis of the flow chart needs to be modified according to formula (2), and the curve trend remains unchanged.
Q2 = Q1 X FG X FT Formula (2)
In the formula, Q1 is the initial flow rate scale, Q2 is the modified flow rate scale, FG is the gravity modified coefficient, FT is the temperature modified coefficient. The values of FG and FT can be referred to in Table 1 and Table 2 respectively.
Table 1
Arsine
0.60
Carbon dioxide
0.80
Argon
Hydrogen chloride
0.84
0.87
Silane
Oxygen
0.93
0.94
Air
Ammonia gas
0.98
1.28
Helium
Hydrogen
2.65
3.72
Table 2
-40
-40
1.12
-20
-28
1.10
0
-17
1.07
20
-6
1.05
70
20
1.00
100
37
0.97
150
65
0.93
212
100
0.89
250
121
0.86
300
148
0.84
350
176
0.81
400
204
0.78

Application Examples
FITOK pressure regulator products
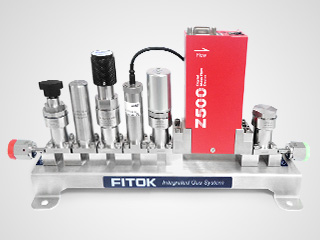
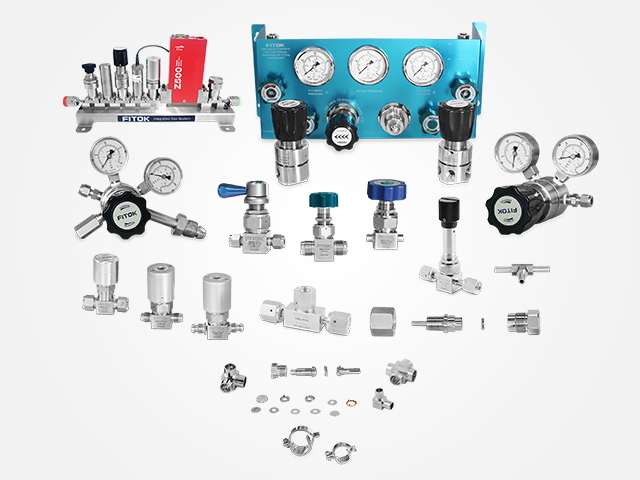
Regulators suitable for high purity (HP) and ultra high purity (UHP) application: RTCC Series Miniature Tied Diaphragm Regulators, RTGC Series General Tied Diaphragm Regulators, RDCC Series Miniature Diaphragm Regulators and RDGC Series General Diaphragm Regulators, etc. Regulators suitable for specialty gas application: RDGC Series General Diaphragm Regulators, RDDC Series Two-Stage Diaphragm Regulators, RDSC Series Sensitive Diaphragm Regulators and RPGX Series High Pressure Piston Regulators, etc. Changeover systems suitable for uninterrupted gas supply: FDR-1 Series Manual Changeover Systems, FDR-2 Series Manual Changeover Systems, CEPR Series Automatic Changeover Systems, and DPPR Series Automatic Changeover Systems, etc.
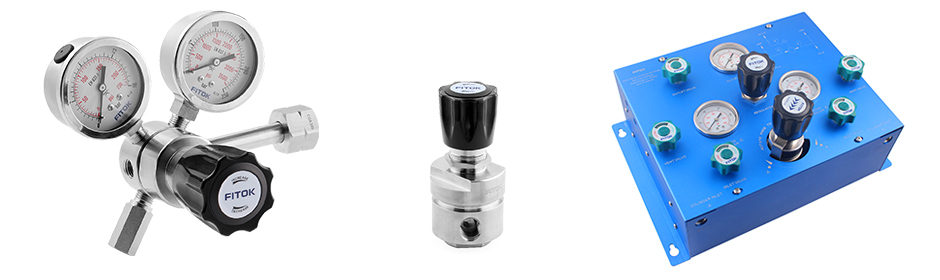
Figure 3 FITOK Pressure Regulator Products
Selection example
For example, the flow chart for FITOK RDSC Series Sensitive Diaphragm Regulators is shown in Figure 4. The customer requires to determine the outlet pressure when the inlet pressure is 3000 psig (206.8 bar), the outlet set pressure is 90 psig (6.2 bar), the operating temperature is 100°F (37°C), and the system medium (CO2) flow rate is 10 SCFM (283 SLPM)
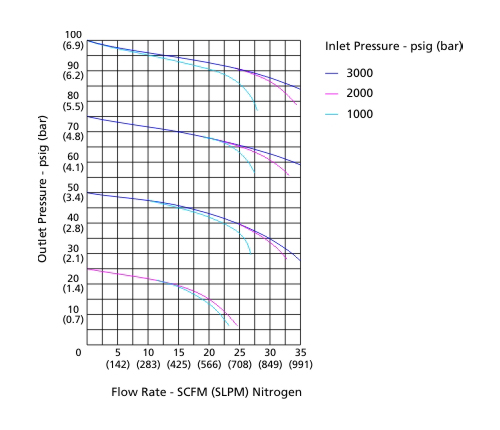
Figure 4 Flow Chart of RDSC Series Pressure Regulators
Since the medium type and operating temperature required by the customer are inconsistent with the test medium and test temperature of the flow chart provided by the manufacturer, the flow rate scale shall be modified according to the gravity modified coefficient (FG) and temperature modified coefficient (FT). As can be seen from Table 1, when the medium is carbon dioxide, the corresponding gravity modified coefficient FG is 0.80. And from Table 2, when the temperature is 100°F (37°C), the corresponding temperature modified coefficient FT is 0.97. Bring the initial flow rate scale (i.e. the horizontal axis value) in Figure 4 and FG and FT into formula (2), calculate to get the modified flow rate scale (example: 3.9 = 5 x 0.8 x 0.97). Replace the horizontal axis in Figure 4 with the modified flow rate scale while keeping the vertical axis and flow curve the same to get a new flow chart as shown in Figure 5.
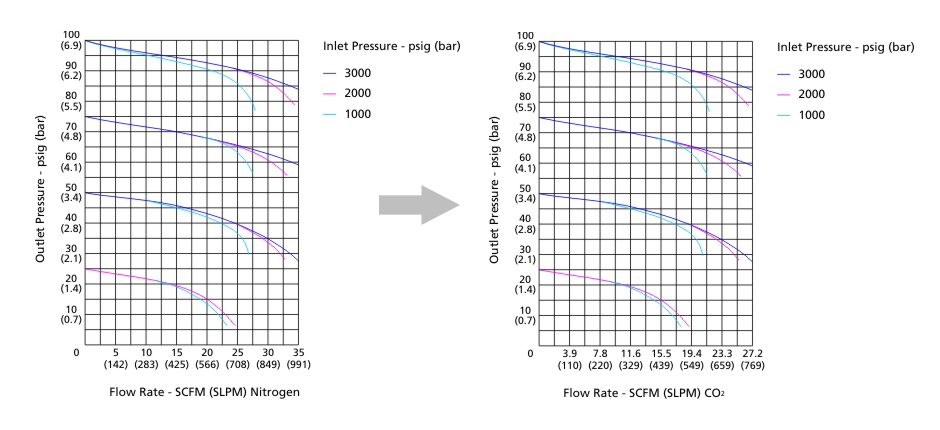
Figure 5 Flow Chart of Pressure Regulators after Modification
As can be seen in Figure 5, the flow curve for the customer's desired inlet pressure of 3000 psig (206.8 bar) and outlet set pressure of 90 psig (6.2 bar) is not shown. We can interpolate and analogize according to the two flow curves for an inlet pressure of 3000 psig (26.8 bar) and outlet set pressures of 75 psig (5.2 bar) and 100 psig (6.9 bar) to get a flow curve for the inlet pressure of 3000 psig (206.8 bar) and outlet set pressure of 90 psig (6.2 bar) as shown in the red curve in Figure 6.
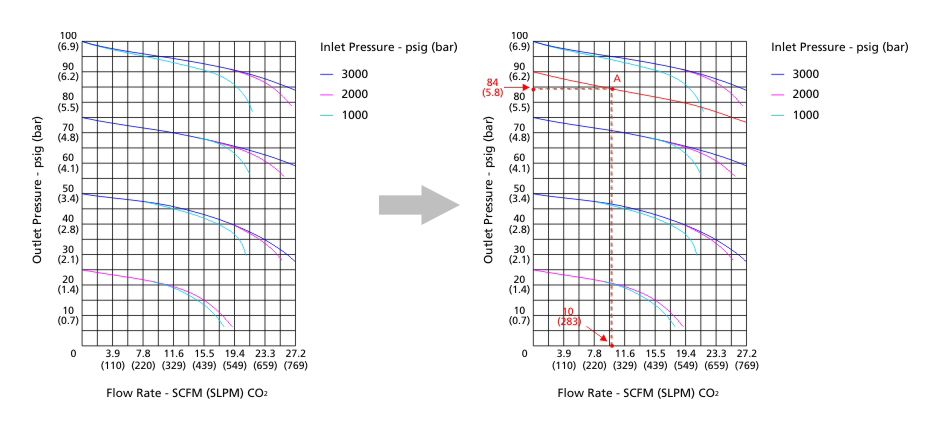
Figure 6 Flow Chart after Interpolation and Analogy
From the flow curve (red curve) shown in Figure 6 for the inlet pressure of 3000 psig (26.8 bar) and outlet set pressure of 90 psig (6.2 bar), find the point A on the curve with horizontal axis scale of 10 SCFM (283 SLPM), and get the actual outlet pressure of 84 psig (5.8 bar) from vertical axis.
Therefore, for RDSC Series Sensitive Diaphragm Regulators at the inlet pressure of 3000 psig (206.8 bar), the outlet set pressure of 90 psig (6.2 bar), the operating temperature of 100°F (37°C) and the system medium (CO2) flow rate of 10 SCFM (283 SLPM), the actual outlet pressure is 84 psig (5.8 bar).
Conclusion
By correctly using the flow chart of the pressure regulators, we can verify whether the working pressure range of the selected type of pressure regulators meets the customer's requirements, thus contributing to rapid and accurate part number selection. In addition, the flow chart can also reflect pressure regulators' pressure regulating performance.
Related Articles: